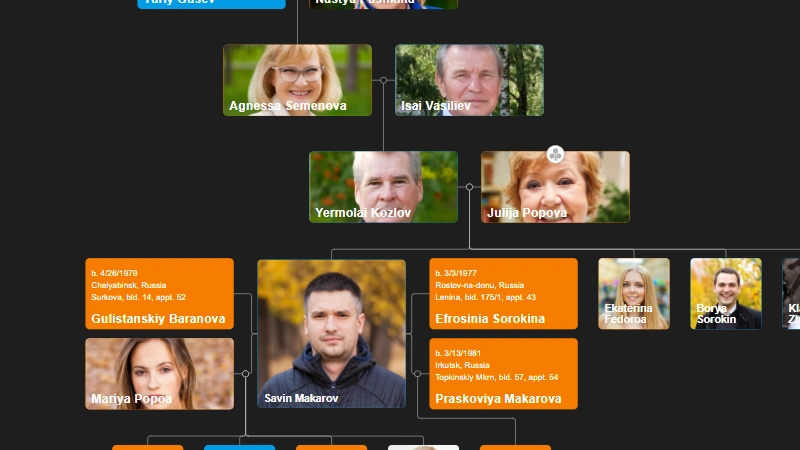
Add Field Data in Expand button with OrgChart JS
Add Field Data in Expand button with OrgChart JS

How to Add Field Data in Expand/Collapse Button with OrgChart JS
OrgChart JS provides a highly customizable way to display organizational charts. One of the useful features is the ability to show additional field data inside the expand/collapse button, which helps users understand more about collapsed nodes at a glance. In this tutorial, we will modify the expand/collapse button to display custom data.
Step 1: Modify the Expand Button
To customize the expand button, we will override the OrgChart.ui.expandCollapseBtn function. This function is responsible for rendering the button, and we can modify it to include additional field data.
Customizing the Button to Show Additional Field Data
Below is the modified expandCollapseBtn function that includes an additional field (e.g., count) inside the expand/collapse button:
OrgChart.ui.expandCollapseBtn =
	function (chart, node, layoutConfigs, action, scale) {
	    if (action === OrgChart.action.exporting
		    || node.childrenIds.length == 0
			|| node.templateName == "split") {
		        return "";
	    }

	    let configName = node.lcn ? node.lcn : "base";
	    let layoutConfig = layoutConfigs[configName];
	    let html = "";
	    let x = 0, y = 0;
	    let t = OrgChart.t(node.templateName, node.min, scale);

	    switch (layoutConfig.orientation) {
	        case OrgChart.orientation.top:
	        case OrgChart.orientation.top_left:
	            x = node.x + (node.w / 2);
	            y = node.y + node.h;
	            break;
	        case OrgChart.orientation.bottom:
	        case OrgChart.orientation.bottom_left:
	            x = node.x + (node.w / 2);
	            y = node.y;
	            break;
	        case OrgChart.orientation.right:
	        case OrgChart.orientation.right_top:
	            x = node.x;
	            y = node.y + (node.h / 2);
	            break;
	        case OrgChart.orientation.left:
	        case OrgChart.orientation.left_top:
	            x = node.x + node.w;
	            y = node.y + (node.h / 2);
	            break;
	    }

	    let collapsedChildrenIds = chart.getCollapsedIds(node);
	    if (collapsedChildrenIds.length) {
	        let btnWidth = 24;
	        let data = chart.get(node.id);
	        let count = data.count ? data.count.toString() : "0";

	        if (count.length == 2) btnWidth = 30;
	        else if (count.length == 3) btnWidth = 40;
	        else if (count.length == 4) btnWidth = 50;

	        html +=
		        OrgChart.expcollOpenTag.
			        replace("{id}", node.id).
			        replace("{x}", x - btnWidth / 2).
			        replace("{y}", y - 12);
	        html +=
		        `<rect
			        e-c="${node.id}" rx="12" ry="12" x="0" y="0"
			        width="${btnWidth}" height="24" fill="#f57c00">
				 </rect>`;
	        html +=
		        `<text style="font-size: 14px; cursor: pointer;"
			        fill="#ffffff" x="${btnWidth / 2}" y="17"
			        text-anchor="middle">
			        ${count}
			     </text>`;
	        html += OrgChart.grCloseTag;
	    }
	    else {
	        x = x - t.expandCollapseSize / 2;
	        y = y - t.expandCollapseSize / 2;
	        html +=
		        OrgChart.expcollOpenTag.
			        replace("{id}", node.id).
			        replace("{x}", x).
			        replace("{y}", y);
	        html += t.minus;
	        html += OrgChart.grCloseTag;
	    }
	    return html;
};
Step 2: Define the Chart and Load Data
Next, we define the OrgChart and specify the data fields:
let chart = new OrgChart(document.getElementById("tree"), {
    collapse: { level: 2 },
    nodeBinding: {
        field_0: "id",
        field_1: "title",
        img_0: "img"
    },
});

let nodes = [
    { id: 1, name: "Denny Curtis", title: "CEO", img: "https://cdn.balkan.app/shared/2.jpg", count: 121 },
    { id: 2, pid: 1, name: "Ashley Barnett", title: "Sales Manager", img: "https://cdn.balkan.app/shared/3.jpg", count: 1212 },
    { id: 4, pid: 1, name: "Elliot Patel", title: "Sales", img: "https://cdn.balkan.app/shared/5.jpg", count: 3 },
    { id: 6, pid: 1, name: "Tanner May", title: "Developer", img: "https://cdn.balkan.app/shared/7.jpg", count: 12 },
    { id: 7, pid: 2, name: "Fran Parsons", title: "Developer", img: "https://cdn.balkan.app/shared/8.jpg", count: 12 },
    { id: 10, pid: 6, name: "Elliot Scott", title: "Developer", img: "https://cdn.balkan.app/shared/10.jpg", count: 12 },
    { id: 14, pid: 12, name: "Mike John", title: "Developer", department: "Sub Development", img: "https://cdn.balkan.app/shared/11.jpg", count: 12 },
    { id: 15, pid: 12, name: "John Scott", title: "Developer", department: "Sub Development", img: "https://cdn.balkan.app/shared/12.jpg", count: 12 },
    { id: 16, pid: 12, name: "Elliot Smith", title: "Developer", department: "Sub Development", img: "https://cdn.balkan.app/shared/13.jpg", count: 12 },
];

chart.load(nodes);
expand button - Add data value(number) in plus - OrgChart JS
Conclusion
By customizing the expandCollapseBtn function, we successfully added field data (such as count) to the expand/collapse button in OrgChart JS. This enhancement provides users with immediate insight into the number of collapsed child nodes, improving the usability of the chart.
Try implementing this in your own OrgChart JS projects and customize it further based on your needs!

OrgChart PDF Cover Page

Minimize and Maximize nodes in OrgChart JS

Copy an OrgChart to Clipboard

Copy OrgChart Data to Clipboard

Pan on Node Is Now the Default in OrgChart JS

Export 2 Charts in a Single PDF

Introducing Liquid Glass Buttons in OrgChart JS

OrgScribe: The Markdown-Style Way to Build Org Charts

Achieve Any OrgChart Design

Why Not Load on Demand in OrgChart JS
JSON Export Slinks with Nodes in OrgChart JS

OrgChart JS Privacy

GEDCOM in Family Tree JS 2

Update a JSON File with Family Tree Members

Hide Nodes in an OrgChart with CSS

Pin (set as root) a node in an OrgChart

WordPress OrgChart Plugin

Family Tree in WordPress

Organizational Charts with Multiple Parents

Introducing new PDF and PNG Previews in OrgChart JS

Building an Org Chart MVP

Introducing PowerPoint Preview in OrgChart JS
Change The Order in the OrgChart by Drag and Drop (Simple Example)

Highlight to the root on search in OrgChart JS

OrgChart JS Now Supports Export to PowerPoint
OrgChart JS Now Supports Export to PowerPoint

Dynamically changing an orgchart field

Project Timeline Chart

OrgChart Conditional Node Size

Add CSS on Export in OrgChart JS

OrgChart JS Angular Templates

Org Chart Web App with Node.js and Express

Loading on Demand with Family Tree JS 2

Dynamic Colors Organizational Chart

Charlie Chaplin Family Tree

Introducing Family Tree JS 2: The Next Generation is Here!

React OrgChart

Create and run an OrgChart Single Page Application with Node.js – beginner's guide.

Export and Import Org Chart to Excel

Adding Custom HTML Elements into OrgChart JS container

Еasily Create a Template in an OrgChart

Node Swapping in an Organizational Chart

Vladimir Putin Family Tree

Bill Gates Family Tree

Create a Tooltip for a ForeignObject Element Hover in OrgChart JS

Custom Aligning Nodes in a JavaScript Organizational Chart

Center and Zoom on Search Click in OrgChart JS

Create Multiline Group Titles in OrgChart JS

Adding Arrows in OrgChart JS Links

Show a Custom Edit Form for a node in OrgChart JS

Jeff Bezos Family Tree

How to Add Material Icons in OrgChart JS

Leonardo DiCaprio Family Tree
Visualizing Dual Reporting Structures with OrgChart JS

Exporting OrgChart JS to A4 PDF: A Step-by-Step Guide

Genghis Khan Family Tree: The Lineage of the Great Khan

OrgChart JS now support Export to Visio

New Export Option: childLevels in OrgChart JS

Elon Musk Family Tree

AI for OrgChart JS: Revolutionizing Organization Charts

Family Tree JS 2 (Preview)

d3 org chart

Our Family Tree App is Now on Android!

Why BALKAN OrgChart JS is the Best Organizational Chart Library

How to Create a JavaScript Flow Chart

How to Add an Organizational Chart to a Mobile Application

How to Create a JavaScript Organizational Chart

OrgChart JS Now Supports PDF Export Per Team

Introducing Family Tree App

Donald Trump Family Tree

Discover Your Roots: Build Your Family Tree with BALKAN App

JavaScript Organization Chart

Instantly create interactive, intuitive flowcharts in seconds

JavaScript Hierarchy Chart

Mermaid js alternative

Create Flowcharts in Seconds with Flow Chart JS: Your New Favorite JavaScript Library

Customizing Filter UI - Code of The Week

Zoom Slider - Code of The Week

Bookmarks - Code of The Week

Customizing Search Results - Code of The Week

Introducing Undo Redo - Code Of The Week

Price adjustment announcement

The price will increase for new customers

Buttons for adding family members to a family tree - Code of The Week

Levels - Code of The Week

Change node color from a button in the Edit Form - Code of The Week

Filter and Highlight Nodes - Code of The Week

Up Expanding - Code Of The Week

Programmatically move the chart - Code of The Week

Siblings in Family Tree JS - Code of The Week

Purple template - Code of The Week

Assistant With Children - Code of The Week

Conditional Layout - Code of The Week

Conditional Color - Code of the Week

Sriniz Family Tree Template - Code of The Week

Color Picker - Code of The Week

Add company logo as watermark in exported PDF documents - Code of The Week

Mind map - Code of The Week

Create relationship with circle menu - Code of The Week

Animated Photos - Code of the Week

Grouped Dotted Lines - Code Of The Week

Dotted Lines - Code Of The Week

Department Dynamic Title - Code Of The Week

Add expand button for partners - Code of the Week

Change the sub levels with Drag and Drop - Code of The Week

Custom Edit From using Popover - Code of the Week

Sub levels tag option - Code of the Week

Highlights search results directly on Org Chart nodes - Code of the Week

Code of the Week/Relationship maps and Business process diagrams

Search using field name abbreviations - Code of the Week

Dynamic Template - Code of the Week

Read and Write local CSV file using File API and Org Chart JS - Code of The Week

Organizational Chart Path Highlighting and Selection

Modern Template - Org Chart JS

Performance - Org Chart JS
Single parent is supported in Family Tree JS
How To Develop a Flowchart Maker with Org Chart JS
How to upload a photo to Family Tree JS in .NET core
How to change the color of selected node - Family Tree JS
